New Ekonomistas post (in Swedish). Here is an English translation:
How much higher is the unemployment rate because of the Riksbank’s monetary policy the last few years? This is a controversial question that the Riksbank prefers to avoid. Previously I haved reported a calculation of how much higher the unemployment rate has become up to the beginning of 2013, compared with if the policy rate had been kept unchanged at 0.25 percent since June/July 2010. My calculation has been criticized with obscure arguments in a speech by Per Jansson (for instance, that a low policy rate would not have been “realistic”). I have responded to Jansson’s criticism in a previous post. Now I have updated the calculation to include the whole year of 2013. The annual average during 2013 of the unemployment rate has as far as can be judged become about 1.2 percentage points higher, corresponding to 60 000 more unemployed, compared with what it would have been with an unchanged policy rate of 0.25 percent since the summer of 2010. With such a low policy rate, the inflation rate would have been higher and very close to the inflation target, and, as far as can be judged, the household debt-to-income ratio would have been a few percentage points lower, not higher.
The update is shown in figure 1 (click here for a larger figure in a separate window). The red lines show the actual outcome in percent for the policy rate, the CPIF inflation rate, and the unemployment rate, as well as the outcome in percent of disposable income for the household debt-to-income ratio. The blue lines show the so-called counterfactual outcome if the policy rate had been kept unchanged at 0.25 percent since the summer of 2010. The earlier calculation of the counterfactual outcome ended in the beginning of 2013. Now I have updated the calculation to include the full year of 2013.
I have used the Riksbank’s standard method and standard model, Ramses, to calculate the deviations from the actual outcome that a low policy rate of 0.25 percent would have caused (this is done with so-called unanticipated monetary-policy disturbances, see this speech). Then I have used the analysis in this paper, the results of which are discussed in this post, to calculate the effect on the debt ratio, the ratio between the households’ debt and their disposable income. (The effects on the debt ratio is included because the debt ratio is what that the Riksbank focuses on, not because it would be the best indicator of any risks associated with household debt).[1]
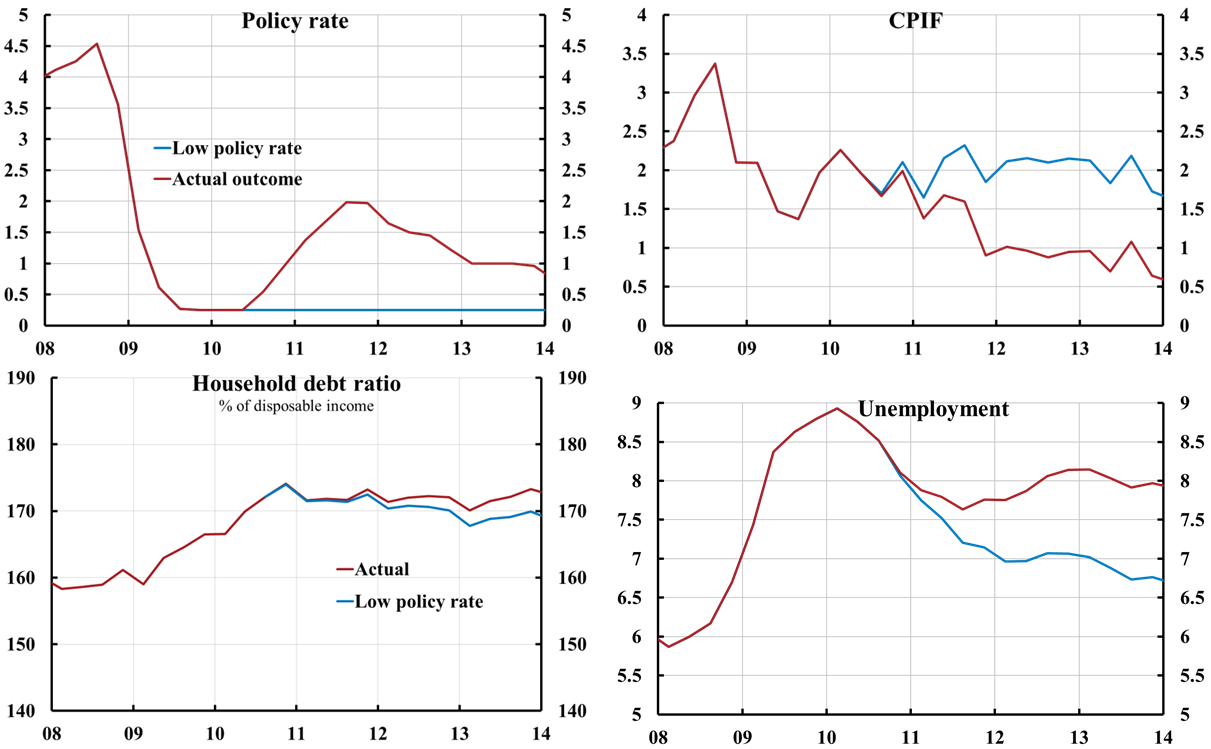
Figure 1. Actual outcome and outcome for the low policy rate for the CPIF inflation rate, the unemployment rate, and the household debt-to-income ratio, updated to include the year 2013.
Sources: The Riksbank, Statistics Sweden, and own calculations.
Table 1 shows the annual averages for 2013 of the unemployment rate and the CPI and CPIF inflation rates, and the debt ratio in quarter 4 of 2013. The annual average of the unemployment rate has become about 1.2 percentage points higher, compared to what it would have been with the low policy rate. CPI and CPIF inflation have become about 1.2 and 1.1 percentage points lower, respectively. With the low policy rate, target achievement for inflation had thus become much better. The debt ratio has at the end of 2013 become about 3 percentage points higher than what it would have been with the low policy rate, about 173 percent instead of about 170 percent.
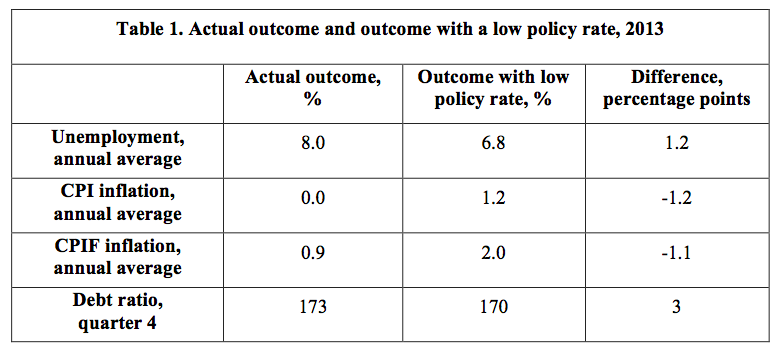
Even if the differences between the actual outcome and the outcome with the lower policy rate would only be half as big, it is still clear that the low policy rate would have led to a much better outcome for inflation and unemployment. The difference in the outcome for the debt ratio is so small that it would not have affected any risks with household debt.
[1] The paper “‘Leaning against the wind’ increases (not reduces) the household debt-to-GDP ratio” derives how the policy rate affects nominal debt and nominal GDP, in order to calculate how the debt-to-GDP ratio is affected. A lower policy rate increases nominal income faster than it increases nominal debt, so it reduces the debt-to-GDP ratio. In order to calculate the effect on the debt-to-income ratio, I have as a simple approximation assumed that real disposable income varies half as much as real GDP. Since a lower policy rate then still increases nominal disposable income more than nominal debt, the debt-to-income ratio still falls.