“Are Swedish House Prices Too High? Why the Price-to-Income Ratio Is a Misleading Indicator,” first version March 2022, revised July 2025.
Paper (latest version). CEPR Discussion Paper. NBER Working Paper. VoxEU column.
Abstract
Appropriate indicators of housing valuation are important for macroprudential policy and assessments of risks to financial stability. Overvalued housing may result in a correction and a fall in house prices, which if large could threaten financial and macroeconomic stability.
According to ECB (2023) and European Systemic Risk Board (2022), Swedish owner-occupied housing (OOH) was overvalued by about 55% in 2021q2, the largest overvaluation in the EU and EEA; according to European Commission (2023c), by about 30% in 2022. These assessments affect warnings and recommendations issued for Swedish economic policy and the shocks in EBA stress tests of Swedish banks.
But these assessments are due to the use of misleading indicators: the deviations of price-to-income (PTI) and price-to-rent ratios from their historical averages. They disregard mortgage rates and other housing costs and lack scientific support. According to a large housing literature, it is not the purchase price but the user cost that is the appropriate measure of the cost of living in OOH, the cost of the housing services that the OOH delivers. From this point of view, “Are house prices too high?” is the wrong question. The right question is, “Are user costs too high?”
New improved estimates of an upper bound of the user cost are constructed, including an adjustment for a preference shift during the coronavirus crisis in favor of larger and better housing. The upper bound results from a conservative lower bound on house-price expectations below the few existing data points—regular time-series expectations data are not available.
According to the user-cost-to-income (UCTI) ratio, Swedish owner-occupied houses have since 2010 instead become increasingly under valued (not overvalued), by about 30% in 2019q4. Due to higher mortgage rates, they are less undervalued in 2025q1, but still about 25%.
For Sweden, the UCTI and PTI indicators are in fact strongly negatively correlated, with opposite signs (see figure 1.2). If the UCTI indicator is the right one, the PTI indicator is consistently wrong. Taking the average of the two indicators is not a good idea.
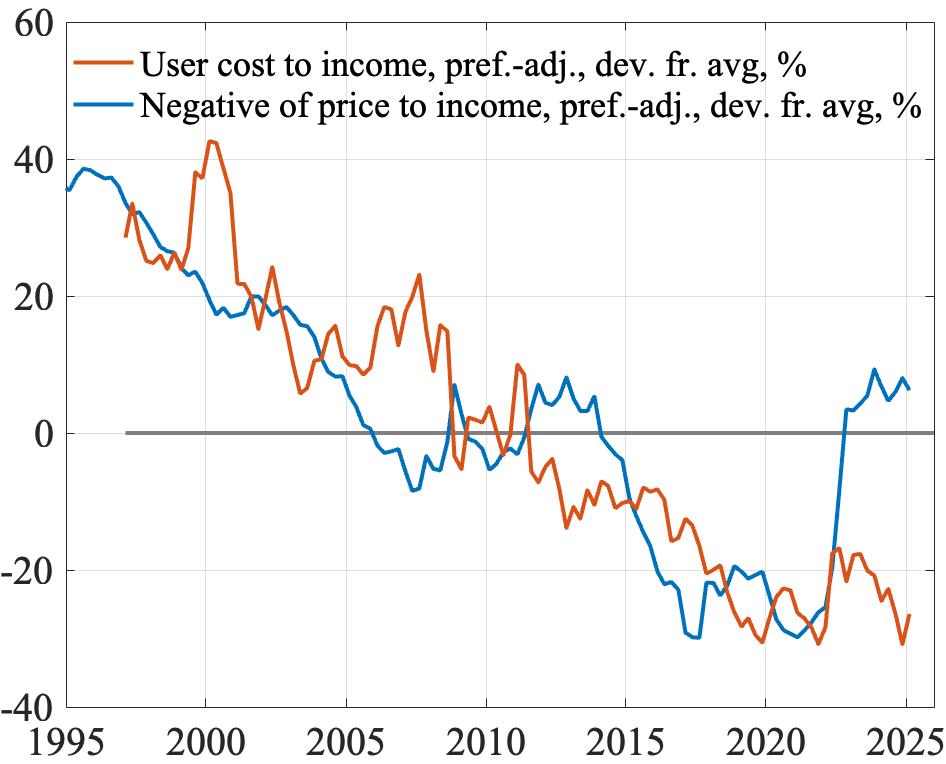
Figure 1.2: The preference-adjusted user-cost-to-income ratio and the negative of the preference-adjusted price-to-income ratio (percentage deviation from historical averages)
The valuation assessments of the ECB, the ESRB, the Commission, the OECD, and the IMF are scrutinized and compared. The problem of misleading indicators and overvaluation assessments—and resulting distorted warnings and recommendations—is not restricted to Sweden but concerns several other countries in the European Union.