English translation of Ekonomistas post (in Swedish)
International studies have shown that economic downturns that are preceded by a large increase in household debt tend to be deeper and more protracted. The Riksbank claims, however, that a high level of household debt leads to deeper economic downturns. The Riksbank refers to some international studies that are supposed to support its claim. But the Riksbank conceals that these studies rather contradict the Riksbank’s claim. This is yet another example that the Riksbank’s documents and reports, with Harry Flam’s words (in Swedish), are not “comprehensive, professional and impartial, but seem to be doctored to support a particular view.”
The household debt(-to-income) ratio has increased rapidly in the past but has been broadly stable since the fall of 2010 (when Finansinspektionen, the Swedish FSA, introduced a mortgage cap). Therefore, it matters for the assessment of the risks in Sweden whether it is an increase or the level that is an indicator of risk.[1]
In its latest Financial Stability Report, the Riksbank writes (p. 48, with accompanying footnotes):
Empirical studies and international experience from countries such as Denmark, the United Kingdom and the United States have shown that highly indebted households adjust their consumption more in connection with various types of shock than households with low debt (see chart 3:9).[68] The high level of debt in the household sector may thus aggravate economic downturns and have serious negative effects on unemployment and economic growth.[69]
68. See for example Andersen, Asger Lau, Duus, Charlotte och Jensen, Thais Lærkholm (2014), ”Household debt and consumption during the financial crisis: Evidence from Danish micro data”, Working Paper. Danmarks Nationalbank.
69. Mian, Atif, och Amir, Sufi (2014), House of debt: how they (and you) caused the Great Recession, and how we can prevent it from happening again. University Of Chicago Press.
Denmark
The Danish study by Andersen, Duus and Jensen of Danmarks Nationalbank is of particular interest here, and is also emphasized in the Financial Stability Report. Chart 3:9 in the Stability Report indeed reproduces Chart 9 of the Danish study. It shows that households with higher debt ratio in 2007 decreased their consumption more from year 2007 to year s, where s is given by the years 2008, 2009, 2010 and 2011.

However, this result says nothing about why households with higher debt ratio decreased their consumption more. Without knowing why households reduced their consumption, one cannot judge whether or not the result is relevant for Sweden. However, the Danish study actually investigates very carefully why more indebted households reduced their consumption.
The conclusion of the study is that it is not that high indebtedness led to abnormally low consumption and abnormally high saving after the crisis. Instead, highly indebted households engaged in an unsustainable overconsumption and unsustainably low saving before the financial crisis. In connection with the crisis these households returned to normal consumption and normal saving.
The Riksbank, however, conceals this important explanation as to why consumption declined, in spite of the fact that the explanation is crucial for assessing whether the Danish result is relevant for Sweden or not. For whether or not the result is relevant for Sweden then depends entirely on whether there are indications of current overconsumption by highly-indebted households in Sweden.
Why highly indebted Danish households reduced their consumption is clear from Chart 7 in the Danish study. Here we see that highly indebted Danish households before the crisis consumed an unsustainably high proportion of their disposable income, much more than 100 percent. They apparently used their loans to fund this unsustainable overconsumption. In connection with the crisis, they decreased their consumption to an in Denmark normal (but in an absolute sense still high) percentage of disposable income.
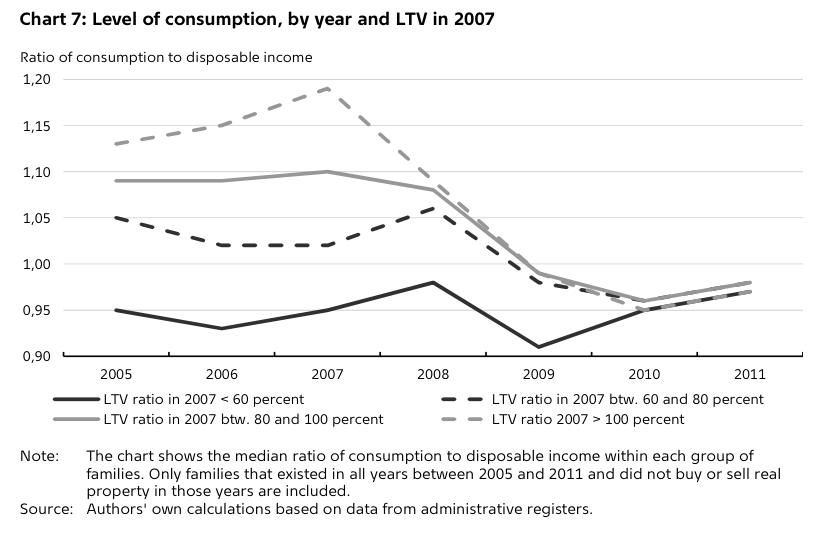
Andersen, Duus and Jensen accordingly write (p. 3):
[Our] analysis … shows that the difference in the change in consumption between high- and low-leverage Danish households is almost exactly mirrored by an opposite-signed difference in pre-crisis consumption levels: In 2007, highly leveraged households spent a much higher fraction of their income on non-housing consumption than households with less leverage, conditional on other characteristics. However, by 2010 this level difference had vanished completely.
In light of this latter result, we question the view that the high debt level of Danish households has suppressed private consumption in the aftermath of the financial crisis. Rather, it seems plausible that the build-up of debt prior to the crisis helped high-leverage families reach unsustainably high consumption levels in the years leading up to the crisis, prompting a large reduction in spending when the Danish economy was hit by the international financial turmoil.
For the Danish results to be relevant for Sweden, one must therefore argue that highly indebted households in Sweden are engaged in an unsustainable overconsumption. But if this phenomenon would be so extensive as to have macroeconomic implications, it should show up in the household saving rate being unsustainably low.
The figure below shows the household saving rates for Sweden and Denmark. We see that the Danish saving rate was negative before the crisis and during the crisis rose to zero. The Swedish saving rate is much higher and has in recent years increased substantially and is now at a historically high rate.

Source: OECD.
Based on this, there is no indication that highly indebted Swedish households are currently engaged in an unsustainable overconsumption that has macroeconomic significance. There is no indication that the loans are used to fund a large overconsumption. Instead, everything indicates that Swedish households are saving more than ever.
These facts are of course well known at the Riksbank, and they are important to assess whether the Danish study and its result are relevant to Sweden or not. Despite this, the Riksbank apparently chooses to conceal these facts and instead gives a distorted and sanitized picture of the Danish study, presumably so as not to undermine the Riksbank’s claim above that “[t]he high level of debt in the household sector can thus exacerbate economic downturns and have major negative effects on unemployment and economic growth.”
The UK
A British study of Bunn and Rostom at the Bank of England shows that, also in the UK, it seems that the fall in consumption in connection with the crisis was mainly due to overconsumption of highly indebted households before the crisis, overconsumption that fell back to normal consumption after the crisis. Chart 7 in the British study shows that households with a high debt ratio had a much greater non-housing consumption as a share of income before the crisis, which after crisis returned to a for the UK more normal consumption share.

The figure above with household saving rates for Sweden and Denmark also shows the household saving rate for the UK. Whereas for Sweden and Denmark the net saving rate (that is, after the deduction of consumption of fixed capital) is reported, for the UK the larger gross saving rate (that is, without this deduction) is reported. The UK saving rate showed a declining trend before the crisis and went up sharply during the crisis, but it is still below the Swedish one, in spite of being reported as a gross rate. It is consistent with overconsumption before the crisis.
The OECD
The Stability Report (p.12) also refers to a chart from a study of OECD countries by Martin Flodén:
During the financial crisis that broke out in 2007, consumption in many cases decreased more in countries with high indebtedness than in countries with low indebtedness (see chart 1:16).
Chart 1:16 shows part of Figure 1 in Flodén’s study, where he tries to isolate the relationship between the debt ratio in 2007 and the change in consumption from 2007 to 2012.

The most remarkable thing about this chart is that the relationship between the debt ratio and the fall in consumption is so weak. This is not surprising when you see figure 1 of this post or chart B of the Bunn and Rostom study. According to Flodén’s study, one percentage point higher debt ratio caused a fall in consumption during 2007-2012 that was only 0.04 percentage points larger. That is, a 10 percentage points higher debt ratio would only cause a fall in consumption that was 0.4 percentage points larger.[2]
In addition, as the discussion above of the Danish study shows, this does not say why consumption fell, whether it was a debt overhang followed by abnormally high saving and low consumption after the crisis, or, as in Denmark and the UK, whether it was an unsustainable overconsumption before the crisis followed by normal consumption after the crisis.
The US
The Riksbank also refers to the acclaimed and important book House of Debt by Mian and Sufi. For those who read the whole book, especially capital 6, it is clear that, regarding the effect on consumption and saving, the main problem in the US was the enormous expansion of credit to low-income households with totally inadequate debt-servicing capacity. This is documented by Mian and Sufi in detail, since they have disaggregated data at zip-code level and can distinguish between zip codes with low-income households and those with higher-income households. This important conclusion is, however, not sufficiently emphasized in the book, something Amir Sufi acknowledged when he and I discussed the matter at a conference last summer. But in any event, the US circumstances are so special in several crucial respects that the US experiences are not very relevant for Sweden.
Harry Flam (here and here, in Swedish) and Annika Alexius (in Swedish) have previously shown several examples of Riksbank documents and reports being not comprehensive, professional or impartial, but apparently having been doctored to support a particular view. The Riksbank’s references to international studies of household indebtedness is another example of this.
Footnotes
[1]. That the debt ratio is a poor measure of the any risks associated with household debt has previously been discussed here and here.
[2]. Furthermore, according to Flodén’s study, one percentage point higher debt ratio would be related to a 0.02 percentage point larger rise in unemployment in a crises, a number that I have used to show that the benefit in the form of lower expected future unemployment of the Riksbank’s leaning against the wind is only about 0.4 percent of the cost in the form of higher unemployment in the next few years (the benefits should of course be more than 100 percent of the cost to justify the Riksbank’s policy).